Free Profit and Loss Dashboard Examples and Templates
These profit and loss dashboards come pre-built with some of the most commonly tracked P&L metrics from the most popular tools. You can also customize your templates later. To get started, just choose a template, connect your data, and your metric visualizations will populate automatically.
No credit card needed • Free forever plan
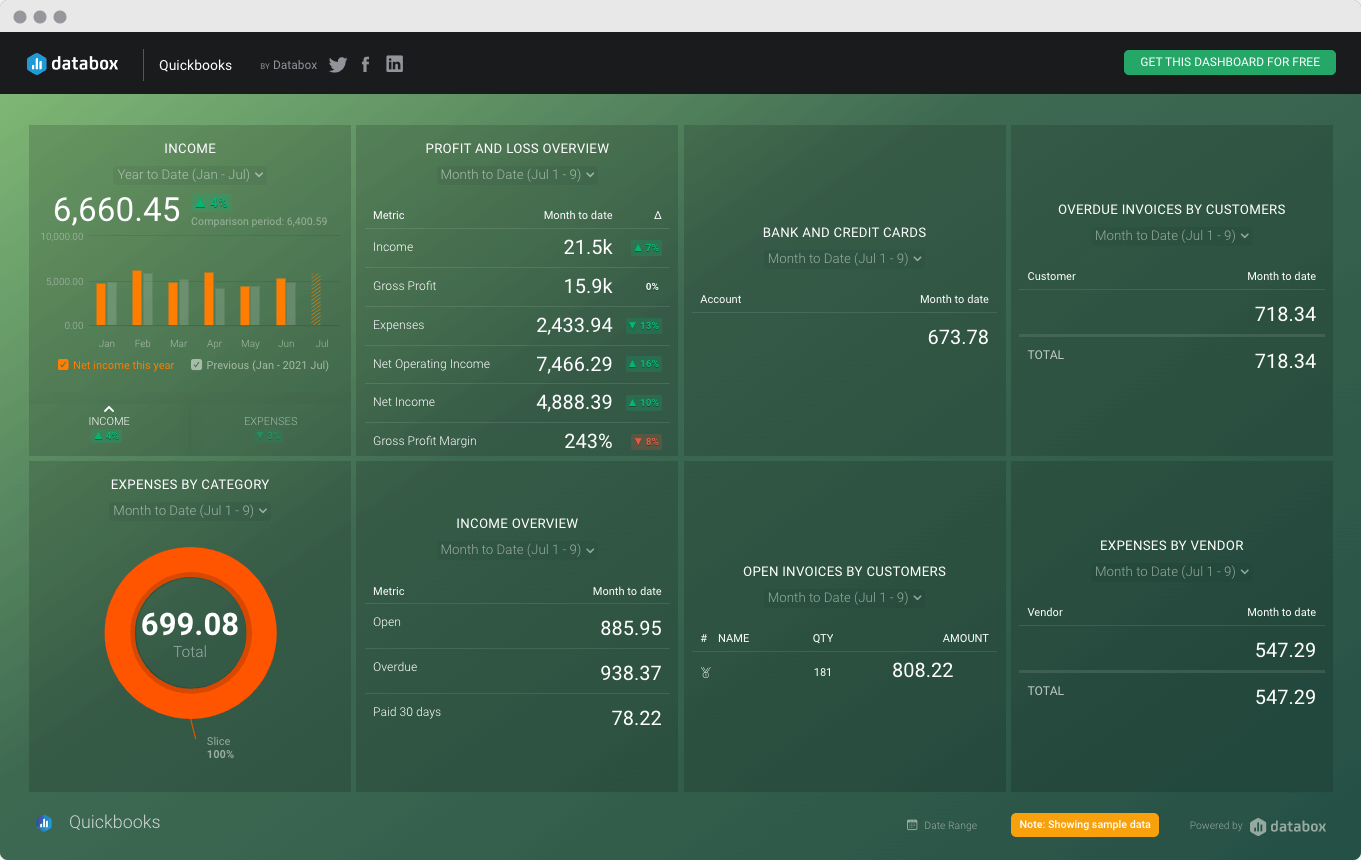
Profit and Loss Overview
The Profit and Loss (P&L) metric displays the business’s income, cost of sales, and total expenses. This key accounting metric can help business owners, bookkeepers, and accountants easily calculate the business’s net profit. The profit and loss metric will help determine whether or not a company’s net profit is consistent month over month.
Key terms
Success indicators
Monitoring Financial KPIs on a Dashboard
Once you have established benchmarks and targets for your Profit and Loss Report, you’ll want to establish processes for monitoring this and other Financial KPIs. Dashboards can be critical in this regard.
Top Profit and Loss Integrations
Creating a Profit and Loss Dashboard
Quickly build your P&L dashboard with Databox’s drag-and-drop designer tool. No coding and design skills are required, just five simple steps and you will have a customized dashboard that’s ready action.
Build custom Profit and Loss dashboards
No design or coding skills necessary.
No credit card needed • Free forever plan
Explore all the different ways you can use Databox to gain better data insights needed to drive better business decisions. Here are just a few examples of the departments and industries that use our pre-built templates on a daily basis to improve performance.